| Year | Country | Korean Pop |
|---|---|---|
| 2021 | United States | 2,633,777 |
| 2021 | China | 2,350,422 |
| 2021 | Japan | 818,865 |
| 2021 | Canada | 237,364 |
| 2021 | Uzbekistan | 175,865 |
| 2021 | Russia | 168,526 |
| 2021 | Australia | 158,103 |
| 2021 | Vietnam | 156,330 |
| 2021 | Kazakhstan | 109,495 |
| 2021 | Germany | 47,428 |
This is a simple blog post with visualization of Overseas Koreans abroad.
The data is from Korean Ministry of Foreign Affairs as of 28 February 2022.
Top 10 Countries with Most Korean Population in 2021
Biggest Differences between 2015 and 2021
| Country | 2021-2015 Difference |
|---|---|
| United States | 394,788 |
| Vietnam | 47,480 |
| Canada | 13,310 |
| France | 10,417 |
| Sweden | 10,266 |
| Germany | 8,381 |
| Denmark | 8,143 |
| Netherlands | 6,810 |
| Norway | 6,623 |
| Australia | 4,450 |
| Country | 2021-2015 Difference |
|---|---|
| China | -235,571 |
| Philippines | -56,005 |
| Japan | -36,860 |
| Indonesia | -23,444 |
| Brazil | -13,878 |
| Uzbekistan | -10,321 |
| United Kingdom | -3,573 |
| Saudi Arabia | -3,325 |
| Thailand | -1,570 |
| Mongolia | -1,156 |
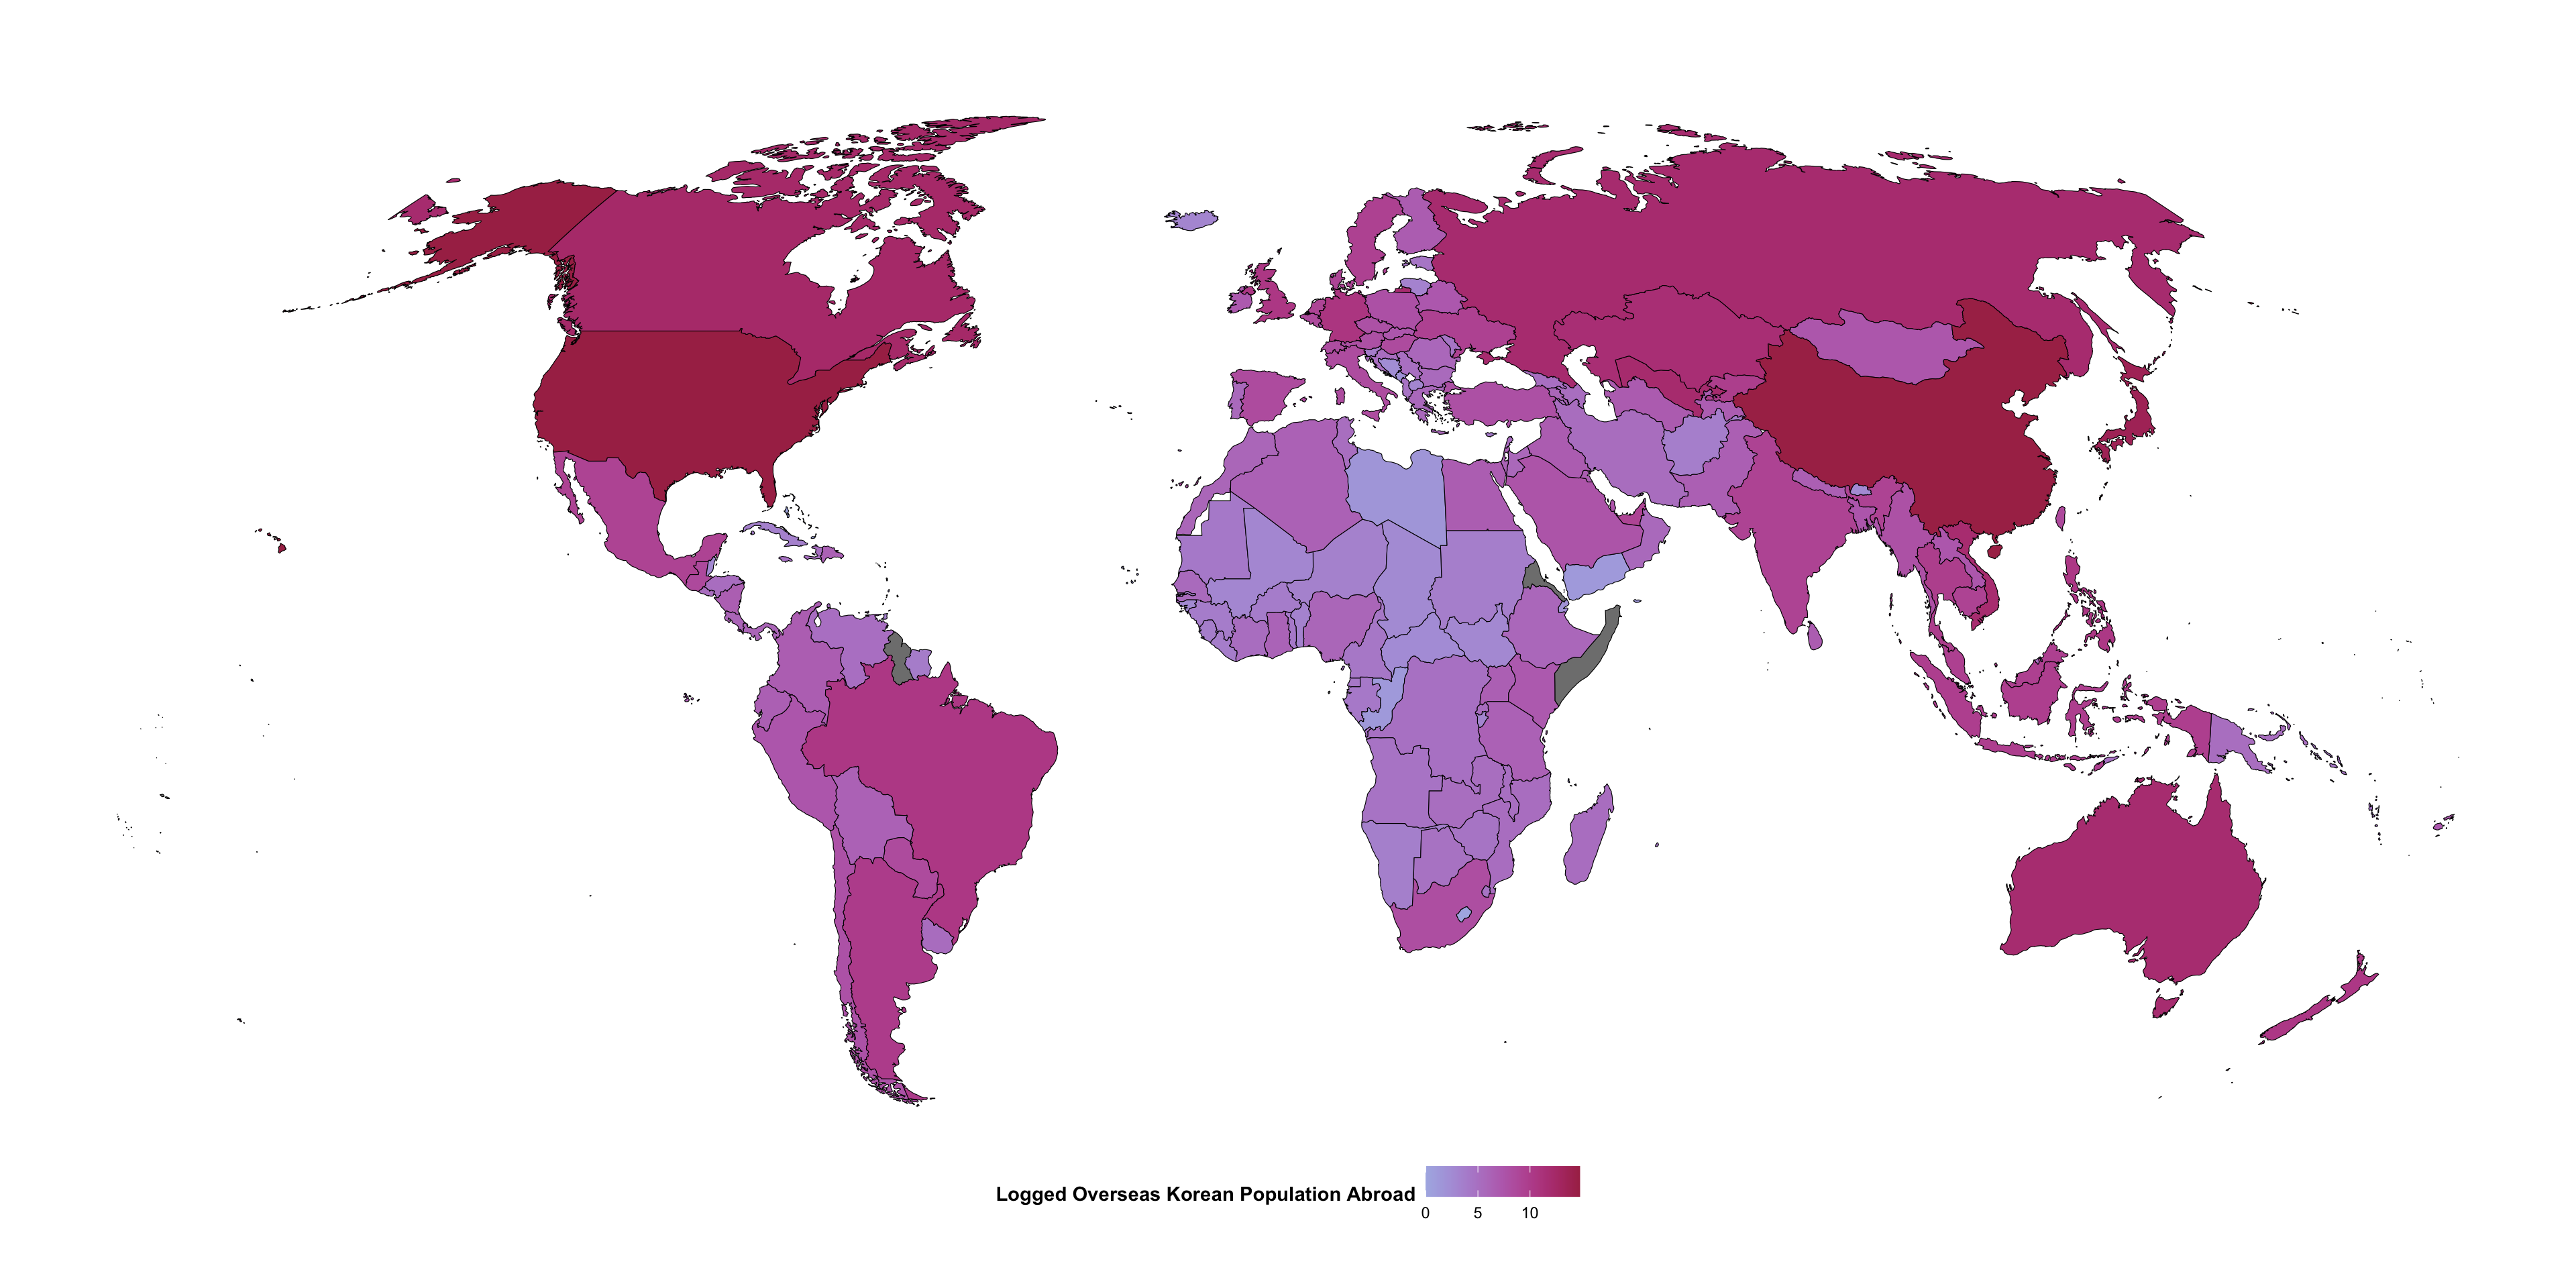
Overseas Korean Population in 2021 on the Map
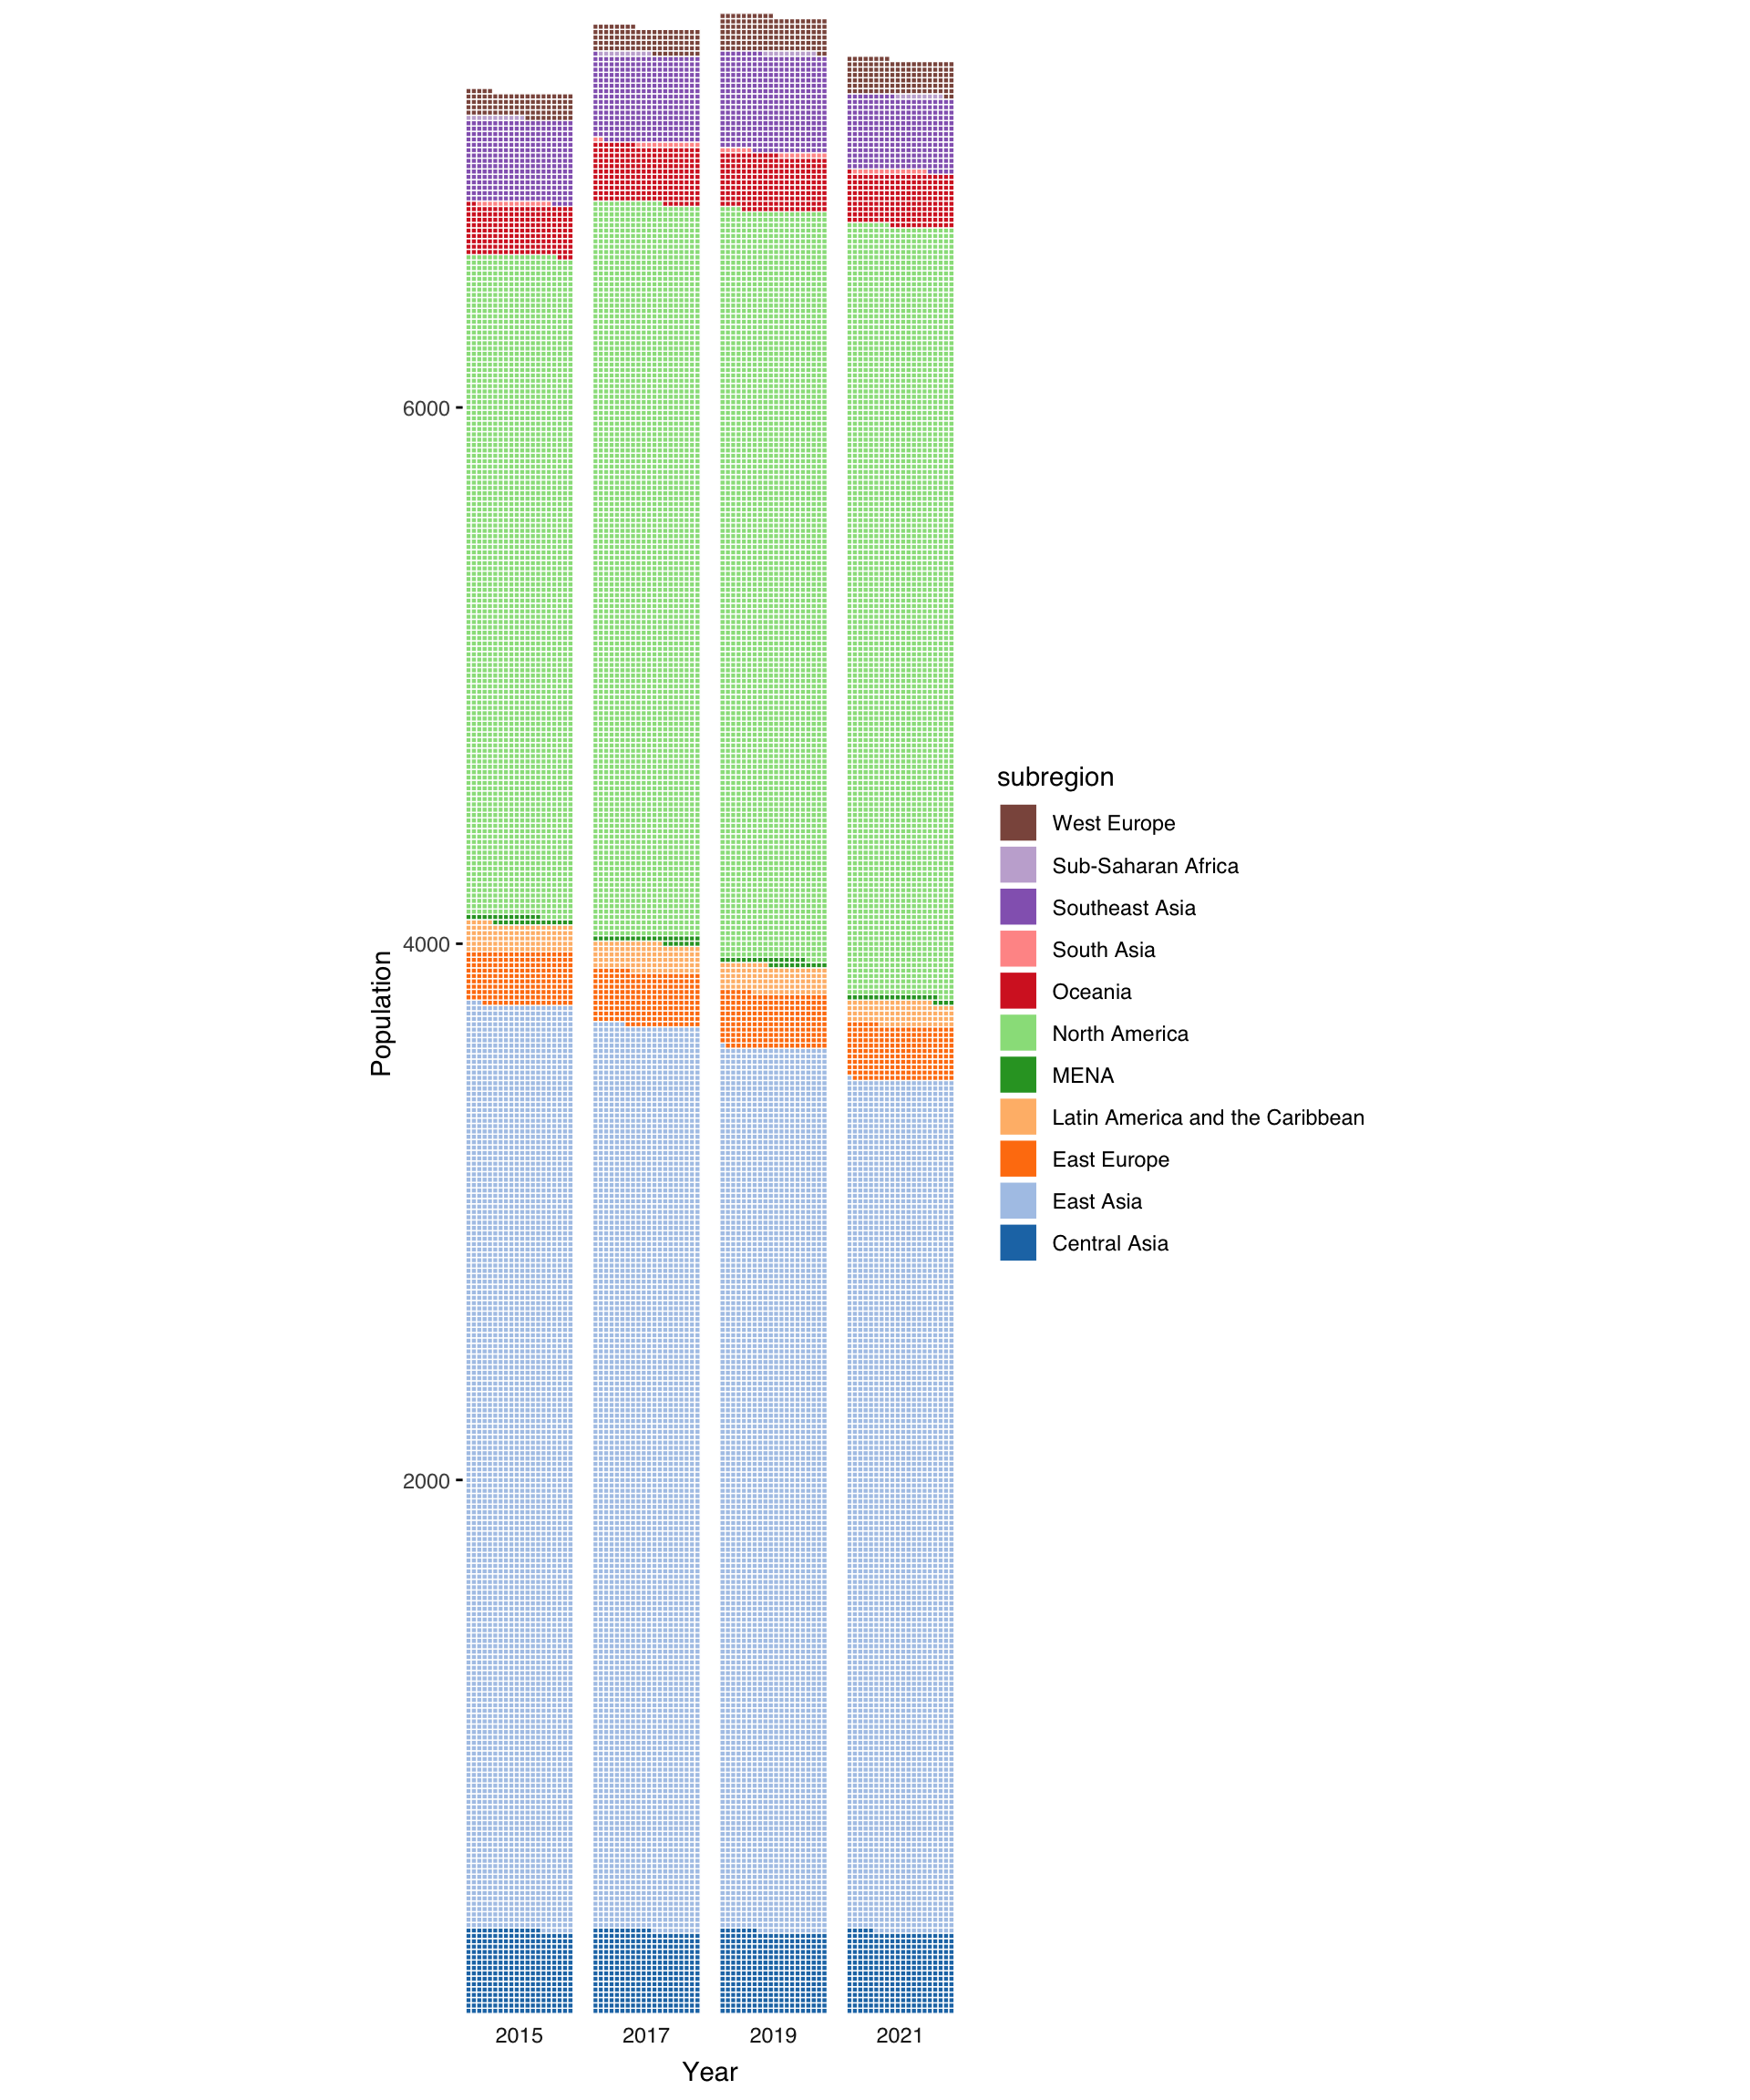
Overseas Korean Population Changes in Years by Sub-regions